Point Cloud Visibility Dataset
Download dataset (23M)What is the "Point Cloud Visibility Dataset" ?
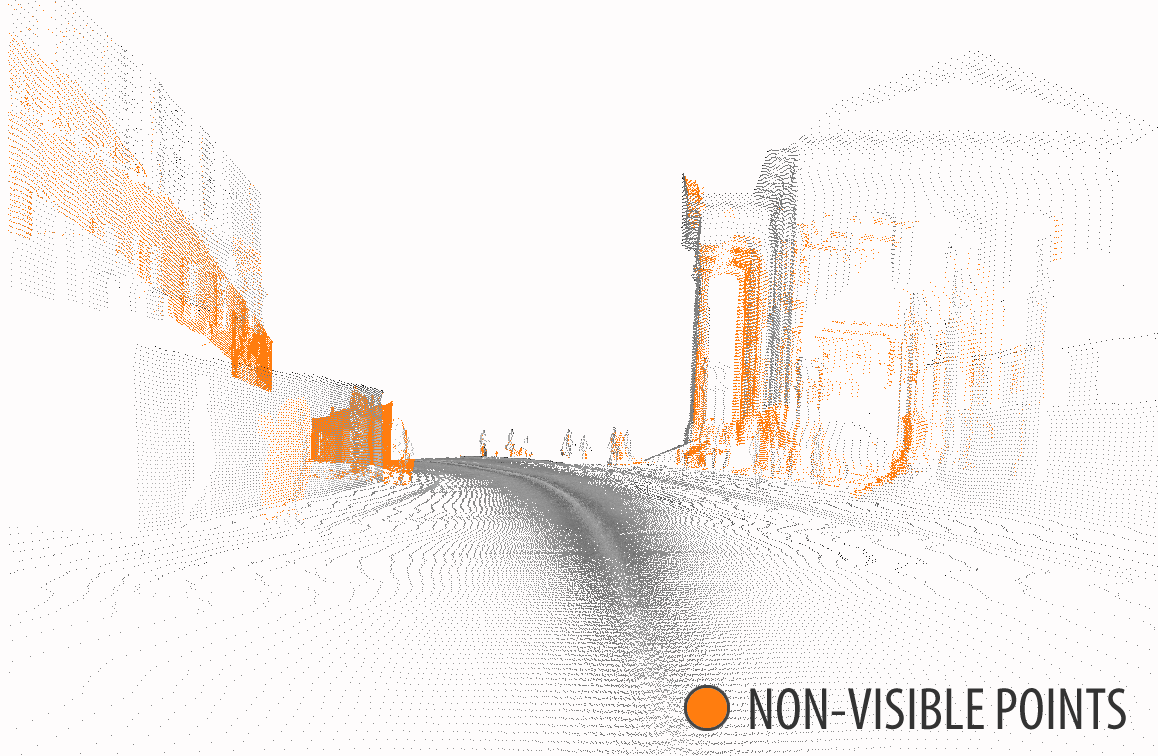
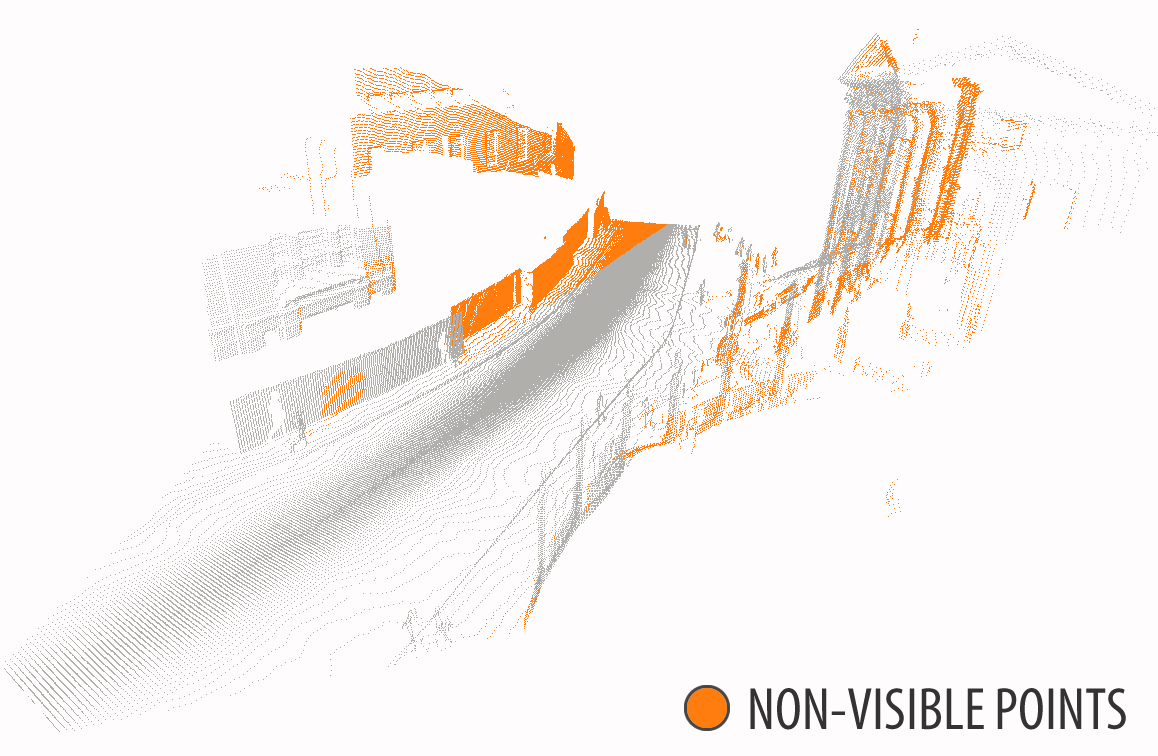
This dataset is made for the evaluation of the estimation of the visibility of a point cloud given a point of view that corresponds to a camera. It consists in more than 1 million manually annotated points divided in 3 point clouds: 2 from close point of views for stability evaluation and 1 of a wide scene for robustness evaluation.
Each of these point clouds correspond to a point of view and are annotated accordingly whether a point is visible or not in this point of view.
This dataset comes as a part of a publication, please read it for further information.
 Viewpoint (optical)
 Point cloud (Projected in viewpoint)
 Point cloud (3D)
How is it organized?
As mentionned above, the dataset simply consists in 3 point clouds. Each point cloud is associated with an image that corresponds to an image acquired at the same location as the point of view, for a better understanding of each point cloud.
The point clouds are in the .xyz text format. In these files, each line represents a point by providing its 3D coordinates, its point of view coordinates in pixel and its label (1 for 3D points visible from the viewpoint, 0 for occluded points) in float format. Therefore, each line can be represented as follows: [x y z u v label].
The archive is organized as follows:
Dataset Folder/
 |
 |-- images/
 |    |-- pov_01.png
 |    |-- pov_02.png
 |    |-- pov_03.png
 |
 |-- point_clouds/
 |    |-- pc_uv_labelled_01.xyz
 |    |-- pc_uv_labelled_02.xyz
 |    |-- pc_uv_labelled_03.xyz
 |
 |-- main.m
 |-- pc2visibility.m
 |-- README
The images/ folder contains the optical images acquired at the point of view of each point cloud. The point_clouds/ folder contains each point cloud as specified above. You will also find two MATLAB files: main.m and pc2visibility.m that allow you to test the method described on the publication linked to this dataset. Finally, the README file is a little guide on how to use the dataset.
How to use it?
Using MATLAB, you can simply load a point cloud and its associated optical image using the following script:
I  = imread('Dataset/images/pov_01.png');
pc = dlmread('Dataset/point_clouds/pc_uv_labelled_01.xyz');
Then, you can access to the different point cloud attributes as follows:
pc(:,1:3) % Lists the 3D coordinates
pc(:,4:5) % Lists the pixel coordinates of the the points projected in the image
pc(:,6)   % Lists whether the point is visible (1) or non-visible (0)
Finally, you can try the method described in our publication by running the following code:
visibility = pc2visibility(pc(:,1:3), pc(:,4:5), [size(I, 1), size(I, 2)]);
visibility = visibility >= mean(visibility); % For mean thresholding
Publication / Citation
This dataset comes as a part of a publication that you can download here:
The Point Cloud Visibility Dataset, as well as the RobotCar dataset one which it is build upon, are povided and can be used under the Creative Commons Attribution-NonCommercial-ShareAlike 4.0 International License and is intended for non-commercial academic use.When using this dataset in your scientific research, please cite our article:
@inproceeding{biasutti2018visibility,
 author  = {Biasutti Pierre and Bugeau Aurélie and Aujol Jean-François and Brédif Mathieu},
 title   = {Visibility Estimation In Point Clouds With Variable Density},
 journal = {VISAPP, Interantional Conference on Computer Vision Theory and Applications},
 year    = {2019}
}
and the RobotCar dataset article:
@article{maddern2017year,
  author  = {Maddern Will and Pascoe Geoff and Linegar Chris and Newman Paul},
  title   = {{1 Year, 1000km: The Oxford RobotCar Dataset}},
  journal = {The International Journal of Robotics Research (IJRR)},
  volume  = {36},
  number  = {1},
  pages   = {3-15},
  year    = {2017}
}